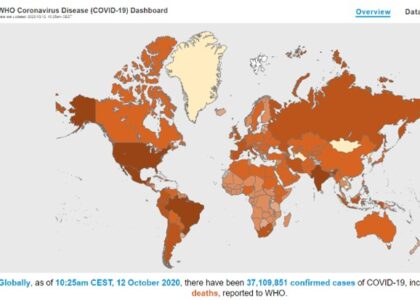
Visual layering and separation is a simple method of simplifying any visual design by removing excessive visuals (Tufte, 1990). In many cases, designers tend to propagate their visual ideas without following a simple systematic direct to point visuals. Meaning, a designer may use a five-pixel pencil to draw a simple line when they could simply use a one-pixel to draw the same line. The Fig-1 below which is a bubble map representation of the number of cases published by WHO (World Health Organization), will be used for a further demonstration of how a design can be layered and separated to its simplest form.

Fig-1 – Bubble map of cases with yellow circles indicating zero cases and dark blue being the most affected areas.
The image below is a world map design to its simplest form. The aim here is to draw the readers attention to a much more important factor marked by the coloured bubbles which are considered affected areas.
Some designers may have concluded this particular design differently by adding extra lines as well as colours to it. However, this would arguably interfere with the data projection objective. The layering of information is normally accomplished by apt deduction of weight, upgrades portrayal of both information dimensionality and thickness on flatland (Tufte, 1990). Typically this includes making a progression of special visualisations, conceivably coordinating a requesting of data content as seen on the above Fig-1.
WHO designers definitely prostrate a very clean and neat design by keeping the background at its simplest grey colour, world map in white with a few simple lines dividing the continents into countries and into cities. They have also included an explanation on the right inside of Fig-1 where the bigger the bubble the higher is the number of cases. This is a perfect example of a design that has been layered and separated to its simplest form.
References:
Covid19.who.int. 2020. WHO Coronavirus Disease (COVID-19) Dashboard. [online] Available at: <https://covid19.who.int/> [Accessed 16 November 2020].
Tufte. E.R., 1990. Envisioning Information. Cheshire, Connecticut: Graphics Press.
Tufte. E.R., 1990. Envisioning Information. Cheshire, Connecticut: Graphics Press. (pp. 81-93). https://www.bbc.co.uk/news/uk-51768274
Zachry, M. and Thralls, C., 2004. An Interview with Edward R. Tufte. Technical Communication Quarterly. [Online], 13(4), pp. 447–462. Available at: https://www.edwardtufte.com/tufte/s15427625tcq1304_5.pdf [Accessed 7 March 2016].


